Custom Network Monitoring Tool: An Old Post
This is a rewrite of an old blog post that was lost over time. I'm revisiting this significant project from my past to document the solution architecture and implementation details.
The Challenge
One of the more substantial projects I undertook several years ago was building a custom network monitoring tool to provide detailed network insights. The project was born from necessity, as the existing network monitoring system was quite basic and didn't enable the network operations team to be proactive. The solution needed to place monitoring probes in all 100 telephone exchanges and large customer sites within our service provider network.
Technical Requirements
The monitoring system needed to perform several key functions:
- Basic reachability tests
- ICMP latency measurements
- Application latency tracking
- DNS performance monitoring
- Inter-probe measurements using TWAMP
- Ookla speed tests
- Iperf speed tests
- Network routing change tracking
The goal was to create a dashboard-based system that would collect all this data and transform it into useful statistics. An unexpected but welcome benefit was how effective the system became as a network troubleshooting platform.
The Architecture
The solution consisted of several key components working together:
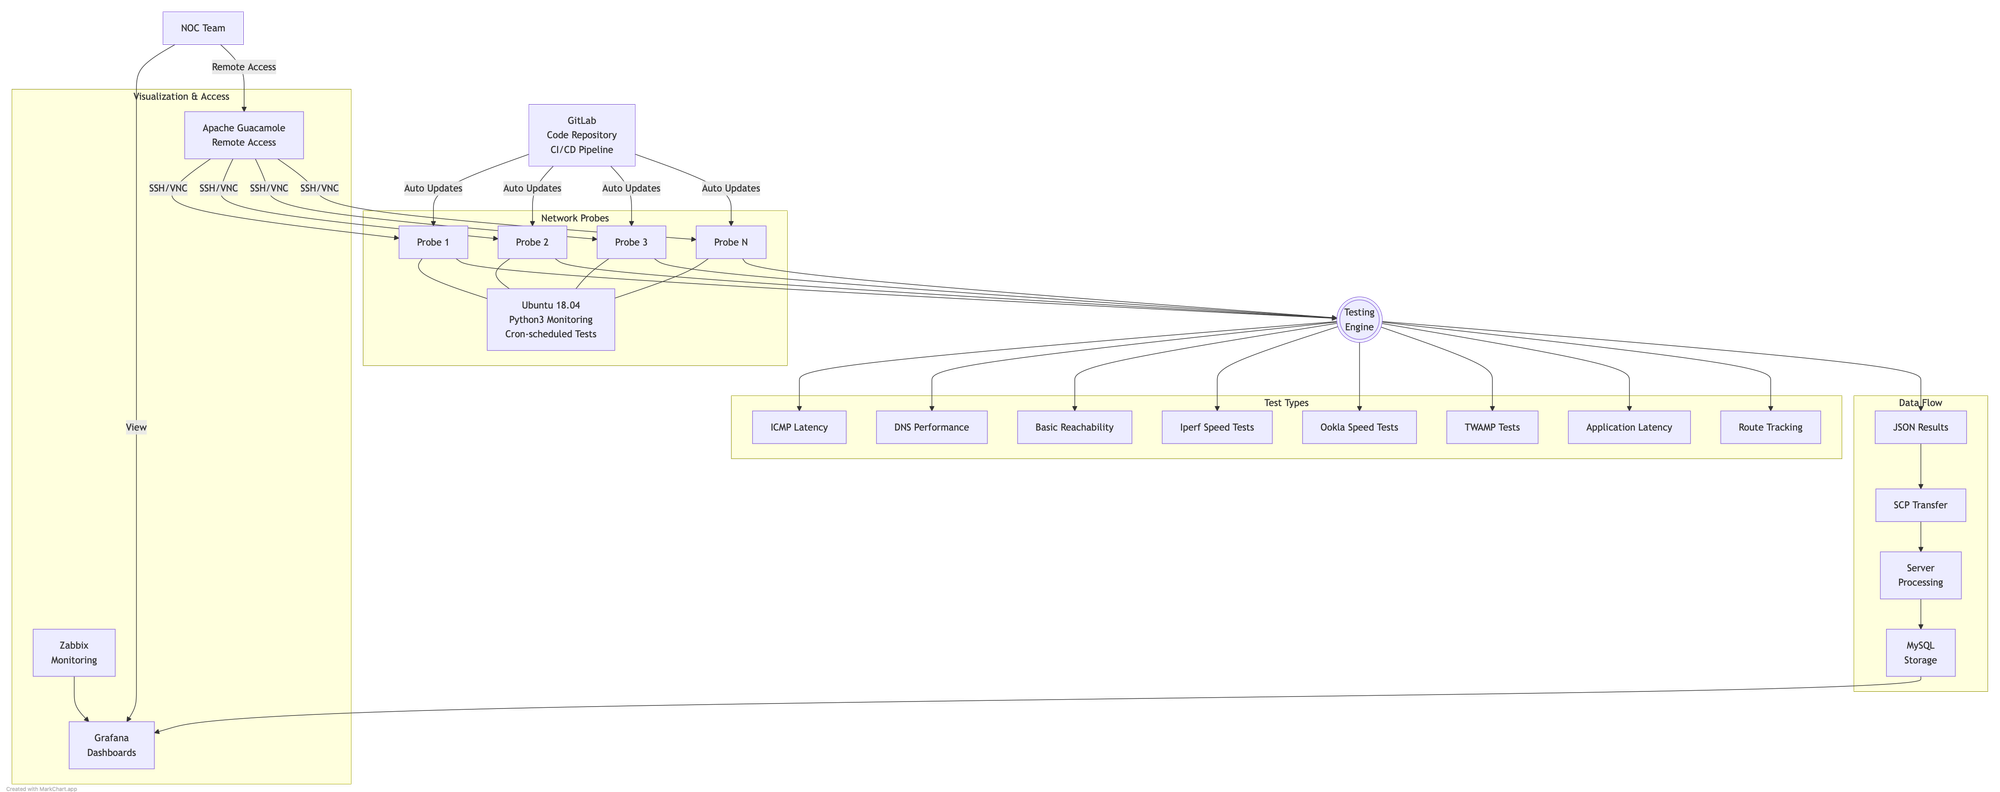
Probes
The hardware probes were small PCB boards running a minimal Ubuntu 18.04 image. Each probe ran a suite of Python3 scripts (my language of choice at the time) that conducted various network tests. To solve the initial challenge of code updates across 100 distributed devices, I implemented an auto-pull system where each probe would fetch the latest code version from our GitLab repository.
The probe workflow was straightforward:
- Execute a series of network tests
- Bundle results into a JSON object
- Transfer results to a central server via SCP
- Wait for the next scheduled run via a cron job
To prevent network congestion when all 100 probes ran 1Gbps Iperf speed tests simultaneously, each probe implemented a random sleep delay at startup.
Central Server
The server component was relatively simple. It:
- Received JSON result packages from probes
- Performed basic validation and logic checks
- Inserted the data into a MySQL database
Database
A MySQL database stored all collected metrics and test results. While simple, it proved sufficient for handling the query volume at the time but in hindsight a time series based DB would have been a better choice.
GitLab
For version control, I deployed GitLab on our internal network. This gave us not just code versioning but additional features like issue tracking and a web-based code editor. GitLab's CI/CD capabilities were particularly valuable, as they allowed us to implement automated workflows and run basic tests that were built directly into the codebase.
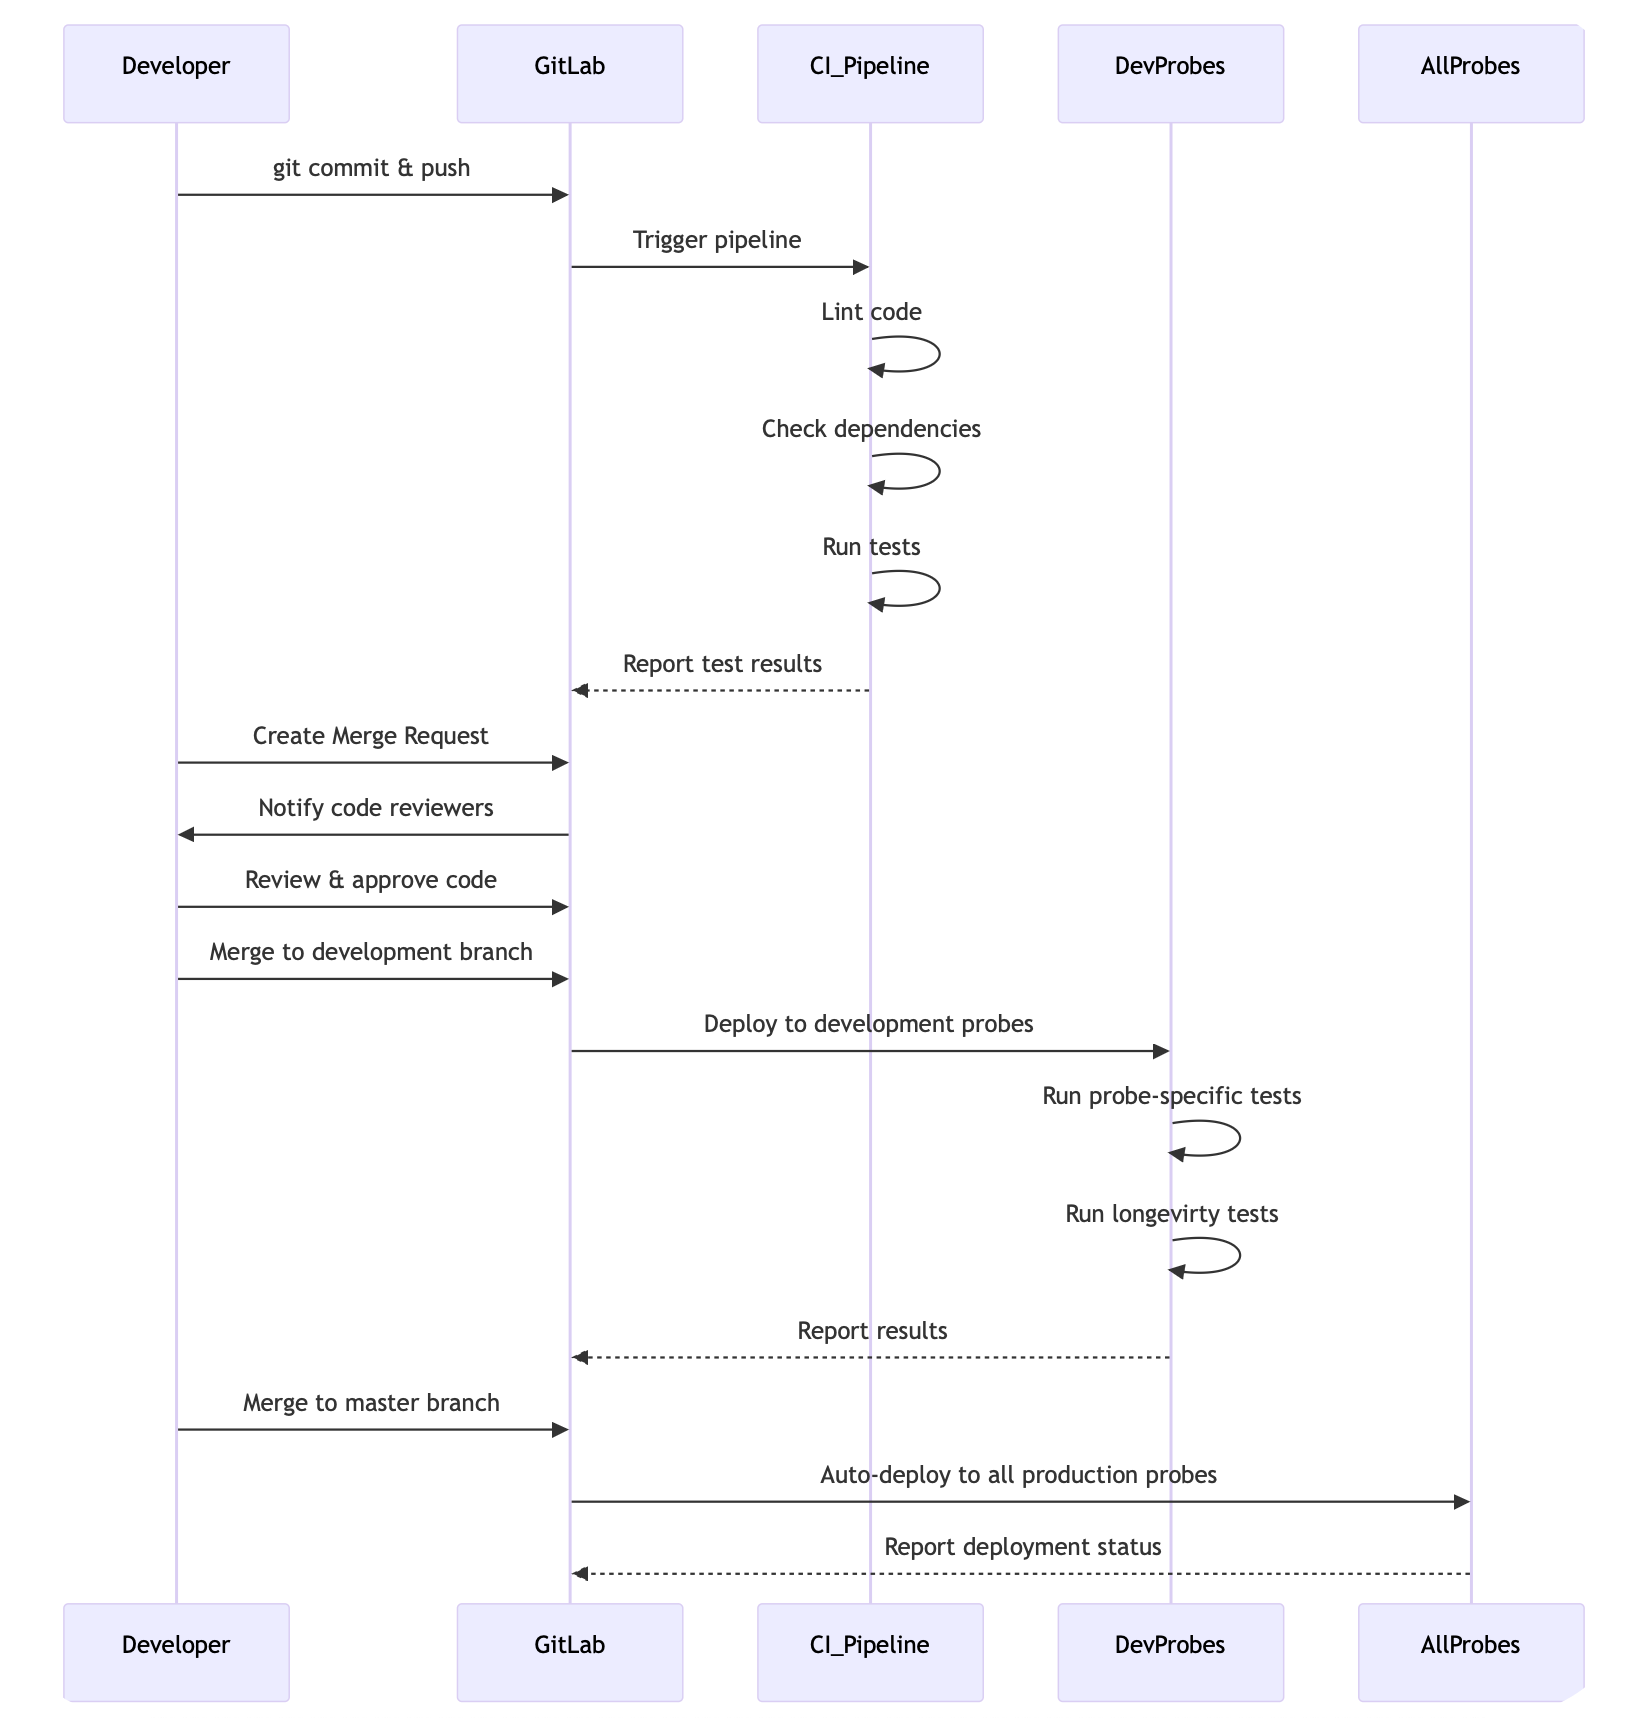
Our typical workflow included:
- Code development on local machines
- Automated unit tests triggered on commit
- Integration tests run in a staging environment
- Testing on designated development probes
- Code reviews via merge requests
- Merging to the master branch for deployment to all production probes
This automated pipeline caught many issues before they reached production and significantly improved our code quality.
Monitoring and Visualisation
To ensure the monitoring system itself was healthy, I set up:
- Zabbix: Monitoring the probes' health and operational status
- Grafana: Creating dashboards from the MySQL data
- Apache Guacamole: Providing clientless remote desktop access to all probes
The Dashboard Experience
The dashboard design was structured into several key views:
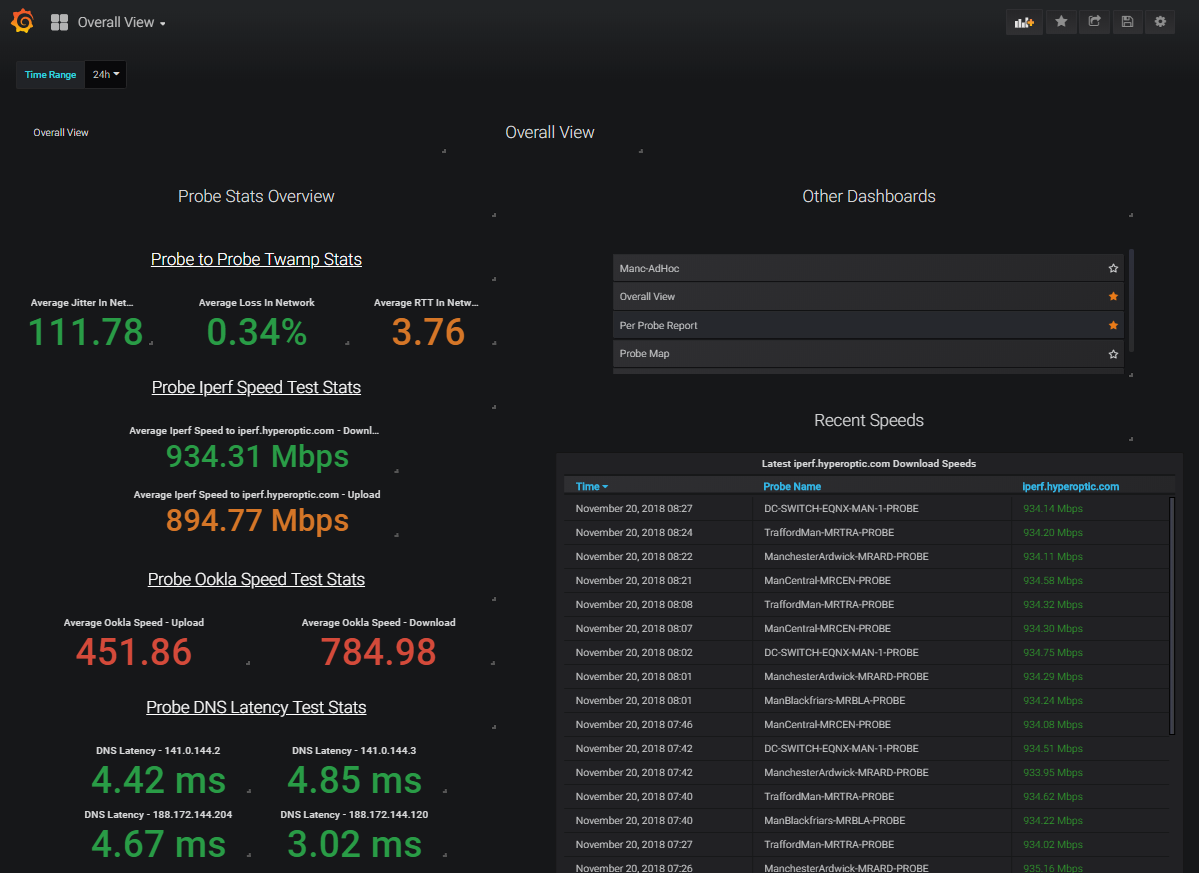
Overall Network Health
This view provided a general overview of the entire network's health, displaying:
- Recent Iperf speed test results
- Average DNS latency
- Average speed test results (both Iperf and Ookla)
- Average TWAMP statistics
Users could adjust the time range from 24 hours to days, weeks, or years.
Per-Probe Reports
For more detailed analysis, per-probe reports showed DNS performance, latency measurements, reachability statistics, and speed test results over time. These proved invaluable for identifying network congestion and service degradation.
Probe Map
Initially just a visual representation of probe deployment locations, the plan was to enhance this to show network outages and issues geographically.
TWAMP Analysis
Following RFC 5357, every probe discovered and performed TWAMP tests with every other probe, creating a complete mesh of tests. This highlighted paths with the highest jitter and round-trip times, revealing interesting patterns. For example, we discovered that paths from the south of the UK to the north were more congested than north-to-south paths, suggesting potential benefits from establishing peering points in northern regions.
Zabbix Integration
The NoC team used Zabbix and as part of this I integrated the probe system for operational health of each probe in the network, and displayed high level alerts.
Troubleshooting Capabilities
Beyond monitoring, the system provided the NOC team with powerful troubleshooting tools:
- Web GUI: For checking content blocks and network connectivity
- CLI Access: For running advanced tests from probe locations
- Apache Guacamole: Allowing multiple team members to connect and view troubleshooting sessions simultaneously—particularly useful when the team was distributed
Testing speed in an ISP network is a nightmare!
The "Hyperspeed" Utility
A small but popular addition was a script aliased as "hyperspeed" on every probe. This allowed engineers to quickly run Ookla and Iperf speed tests from the command line, displaying detailed results including server connections and CPU load metrics.
This was a request from our field support teams who would SSH into these while on site to perform ad-hoc tests during changes or troubleshooting.
Future Plans That Never Materialised
Several improvements were planned but never implemented:
Technical Improvements
- Migrating from MySQL to Elasticsearch for better performance and scalability
- Containerising each test within Docker to allow for greater isolation and easier deployment
Additional Functionality
- IPv6 test support
- Enhanced probe map showing speed test results by exchange
- Comparative transit provider testing (same traffic, same destination, different peerings)
- Expansion to gather statistics from network routers and switches
- Network route change tracking improvements
Lessons Learned
Looking back, this project taught me several valuable lessons:
- Start simple, then scale: Beginning with basic functionality allowed for rapid deployment and iteration. Starting by doing everything at once did not work.
- Automate everything: The auto-update capability saved countless hours of manual work but showed me that testing is key. Without testing you could essentially take the entire system offline.
- Use the right tool for the job: Leveraging existing tools like Grafana and Guacamole accelerated development. Rewriting the wheel is only useful for learning, not speed.
- Design for troubleshooting: The most appreciated features were often those that helped solve immediate problems
While not all planned features were implemented, the system provided significant value to the NOC team and dramatically improved our network visibility. Sometimes the best solutions are the ones that solve real problems for real users, even if they never reach their "final form."
Comments ()